Hanwha Vision · 2025.04 – 2025.05
Keeper AI Reporting: Real-Time Store Analytics Dashboard
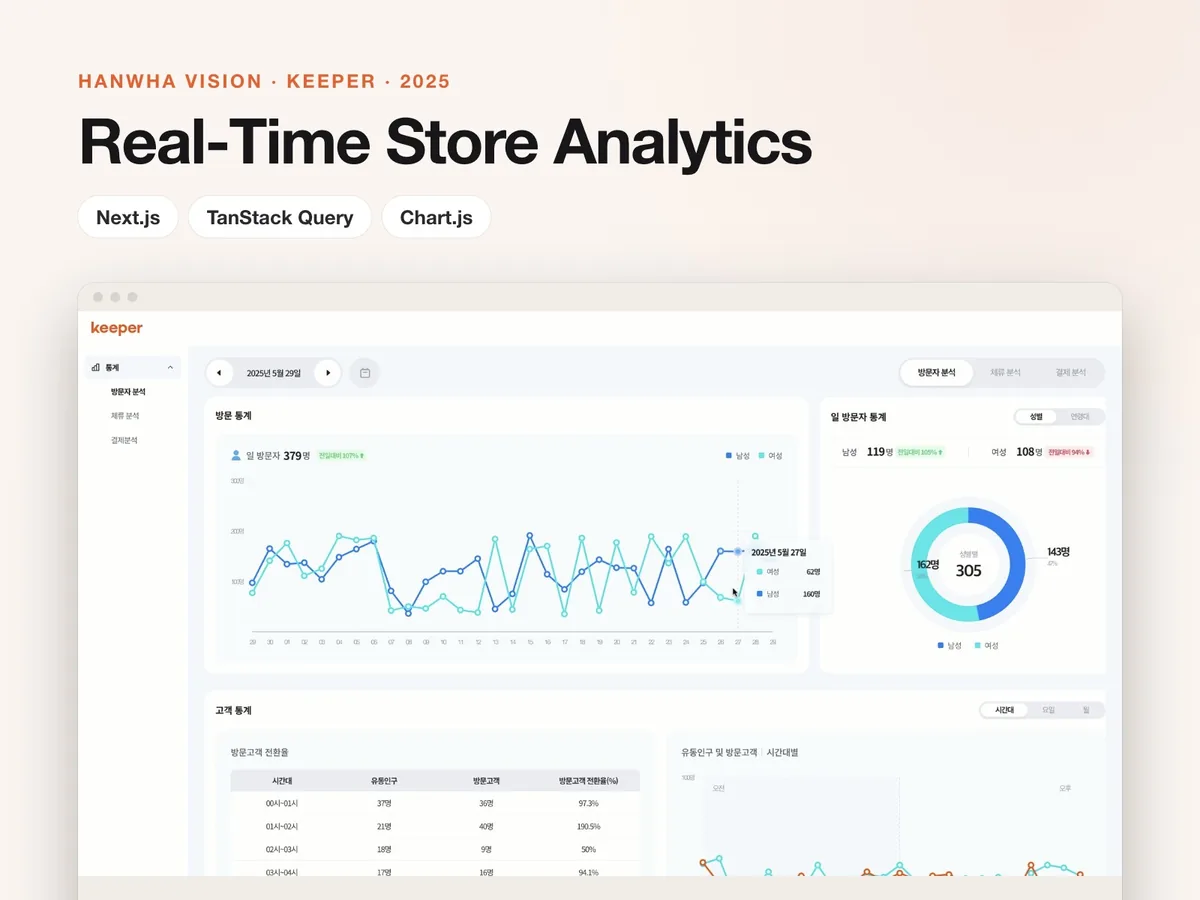
Real-time store analytics from AI CCTV data, with an initial load under 2 seconds.
Overview
I led the frontend architecture and development of a service that turns AI CCTV store analysis into a dashboard. There was no PM, so I turned the requirements into screen flows myself.
Background
Problem
Store owners needed one screen to see the visits, dwell time and movement data analyzed by AI CCTV, and to use it to run the store.
What I did
- Designed and built a real-time dashboard for store data such as visitor counts, dwell time and customer movement.
- Designed the server-state management and caching strategy with TanStack Query.
- Built every dashboard chart with Chart.js, including customer-flow visualization and interactive charts.
- Optimized real-time data handling and rendering.
Results
- Initial load under 2 seconds
Server-state caching and rendering optimization brought a complex dashboard's first load under 2 seconds.
- Led to rollout talks
The quality of the PoC led to discussions about rolling it out to real stores.
Key features
- 01
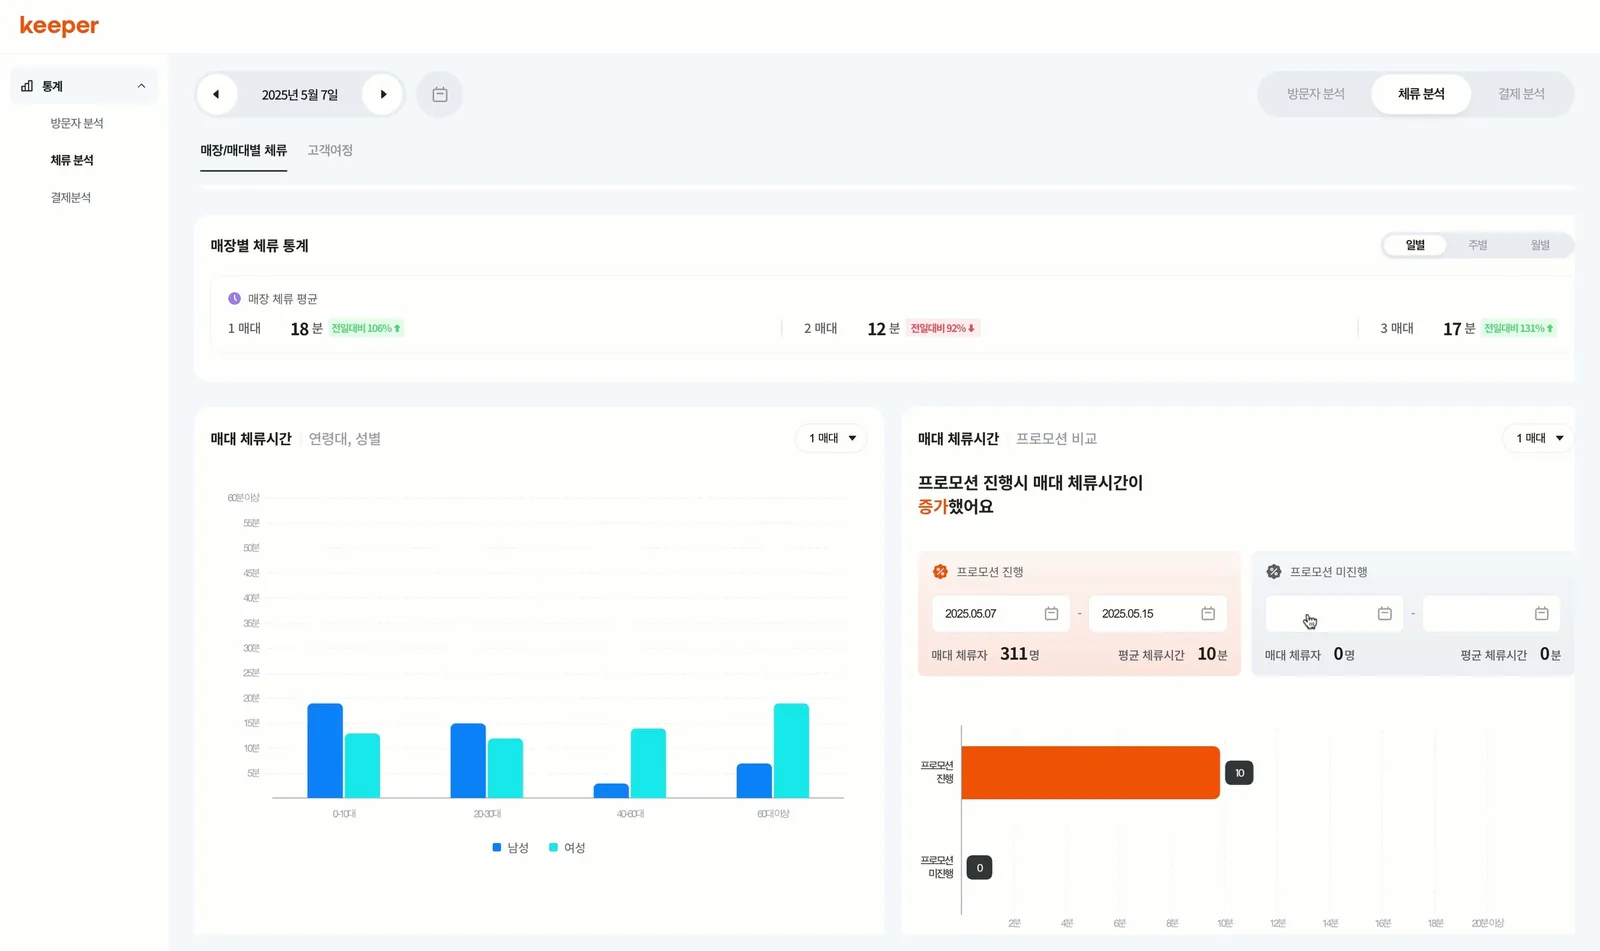
Visit and dwell statistics
Real-time charts for visitors by time of day, gender and age group, and dwell time.
- 02
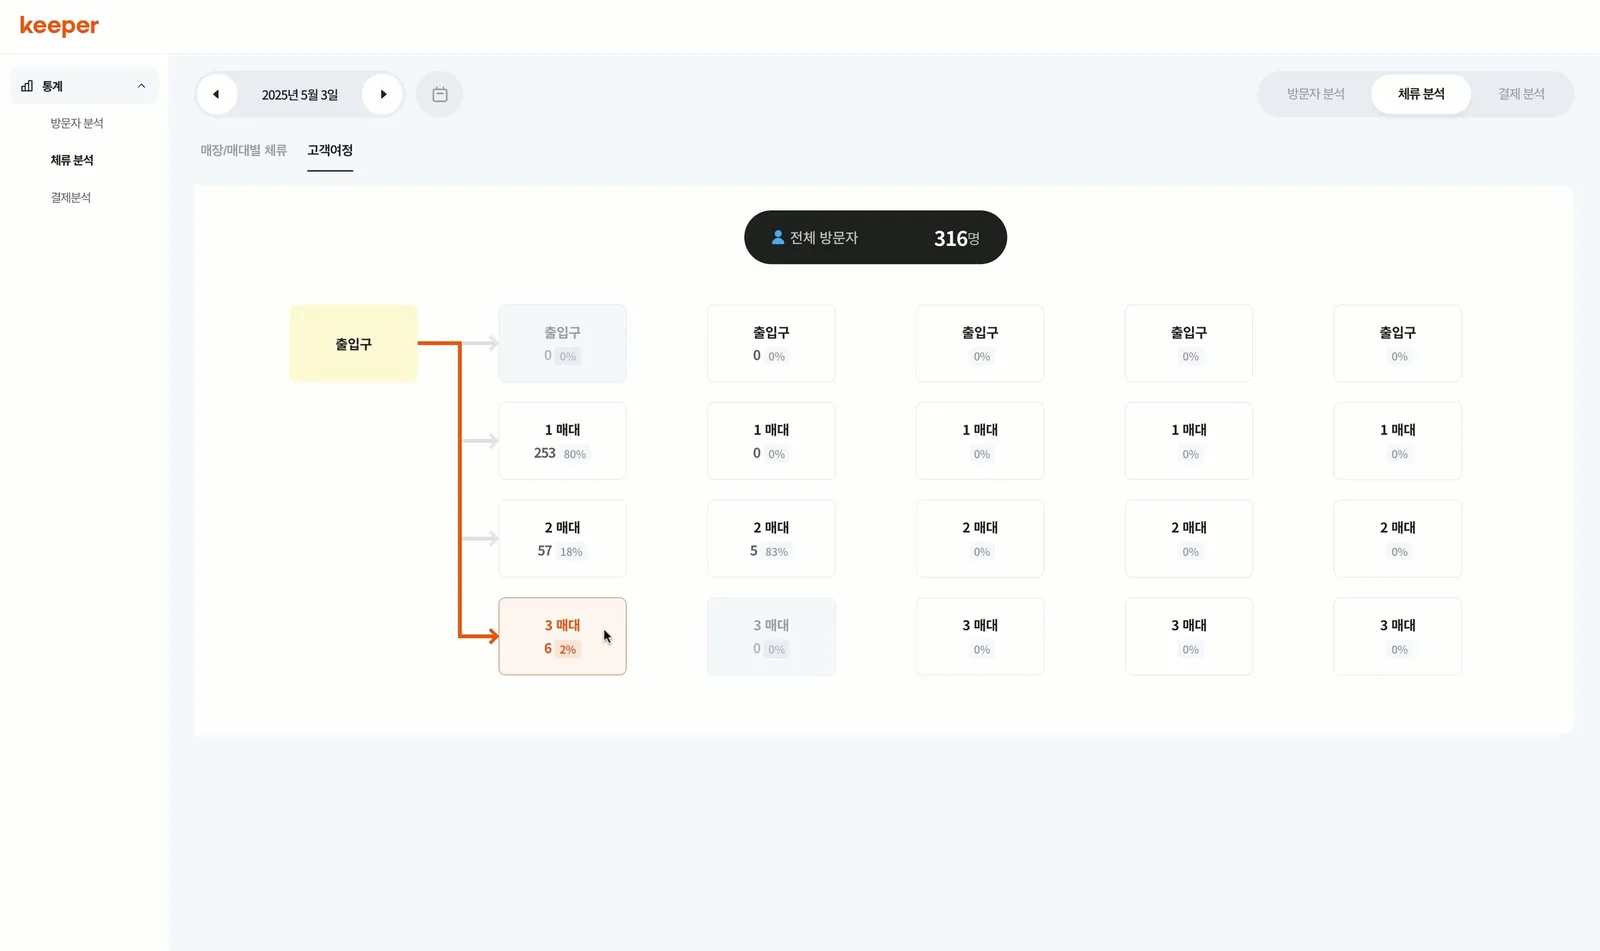
Customer flow visualization
Shows how customers move from the entrance to the shelves.
Screens
※ Images and video show the product as it was during the project.